MANAGE
DFA extracts, transforms, and loads data into a data warehouse.
|
Data IntegratorExtract data from external sources (surveys, administrative MIS, statistical reports). Transform operational data into indicators, and load the indicators into a structured data warehouse. Apply statistical methods to analyze and aggregate microdata into meaningful indicators. Extract big data from non-traditional data sources transform this into meaningful indicators, and load the data into a structured data warehouse to be used for decision support.
|

|

|
Data ManagerCreate an online indicator registry to maintain data and metadata through an authoritative repository of indicators organized by consistent statistical concept schemes, data structure definitions, and code lists. Track the use and customization of these indicators at both international and national levels.
Create an online digital map library to be linked to socioeconomic data, including administrative boundaries, infrastructure (schools, health centers), and other features (roads, rivers, lakes). Establish a data warehouse to be used as an authoritative repository of decision-support indicators, organized in a consistent and well-documented format where each data observation in the data warehouse is described by Indicator, Indicator Metadata, Unit, Subgroup (age, sex, etc.), Geographic Area, Time Period, Data Source. Manage the processes of entering or uploading data for each indicator, including time periods and data sources. Establish data quality validation rules to check for missing data, data outliers, standardization, and trends. Create clean data sets for analytics and reporting. Build reports from the indicators contained in the data warehouse, with a drag-n-drop interface to defined the columns, rows, and aggregations of the report. Sort and apply filters by any of the dimensions of the database. Establish data exchange processes to automatically allow consumers to pull data from providers, based on the needs of the stakeholders of the statistical system. Use international standards for data and metadata to expand the scope for data exchange (SDMX, DDI, IATI). |

|

|
MY DATAUpload your own data from a spreadsheet or CSV file to quickly generate a data visualization in a chart or map.
|

|

|
DATA API
|

|
|
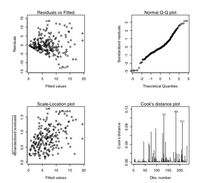
R STATSUse free and open source data R statistical analysis software to run traditional statistical processes to analyze and interpret microdata collected by surveys and administrative systems.
|

|
