ANALYZE
DFA provides powerful tools to analyze and disseminate data.
|
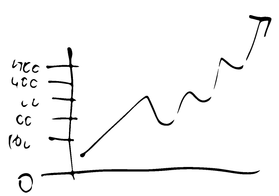
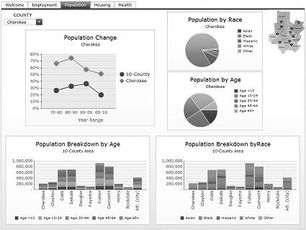
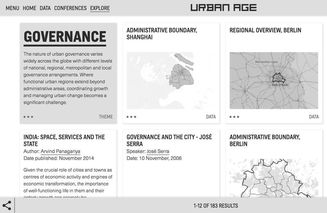
VISUALIZERSearch for data by indicator, geographic area, time period, and data source. Create data visualizations to better understand data patterns and trends. Generate graphs and maps with a drag-n-drop interface to select the type of visualization, color scheme, and data ranges.
|

|

|
REPORT BUILDERDesign reports using drag-n-drop to define columns and rows from data in the data warehouse. Sort, filter, subtotal and format the report. Output the report to PDF, XLS, CSV.
|

|
|
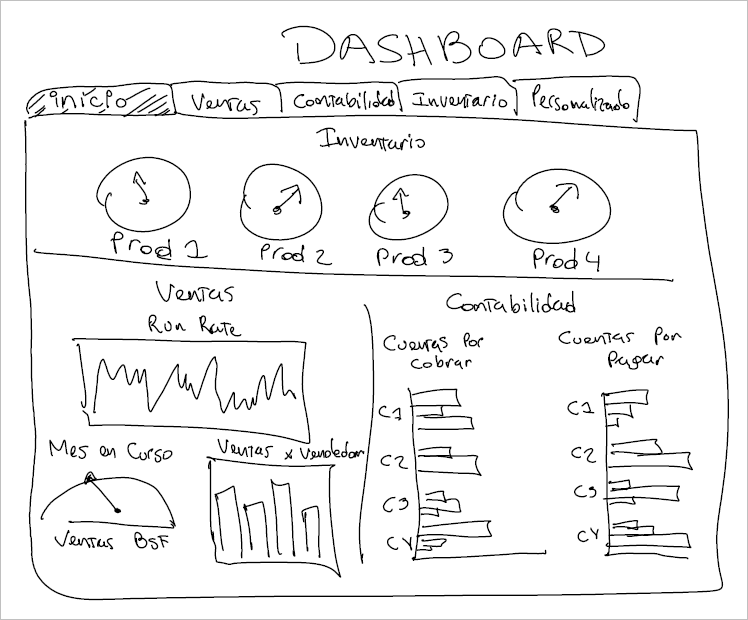
DASHBOARD BUILDERBuild your own interactive online data dashboards from data visualizations. Include links to maps, graphs, tables. Explain the quantitative data displayed in the dashboards with qualitative comments.
|

|
|
PROFILE BUILDERGenerate data profiles on key thematic topics. Design profiles to be used both on and offline to tell a compelling story of the status of a topic in a concise and relevant manner. Generate data profiles at national and subnational levels.
|

|
|
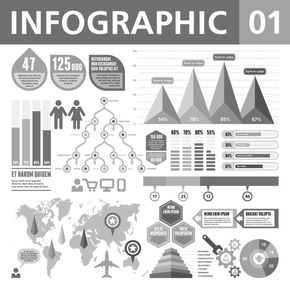
INFOGRAPHIC BUILDERUse your data to create innovative infographics that present complex information simply and clearly. Use the power of data vizualization to convey information quickly and easily to your audience.
|

|
|
DATA STORY BUILDERCreate interactive web sites to use data to tell a story about achievements, challenges, and opportunities. Select from a collection of data story templates, customize the template to your needs, and drag and drop data viualizations into the template.
|

|
|
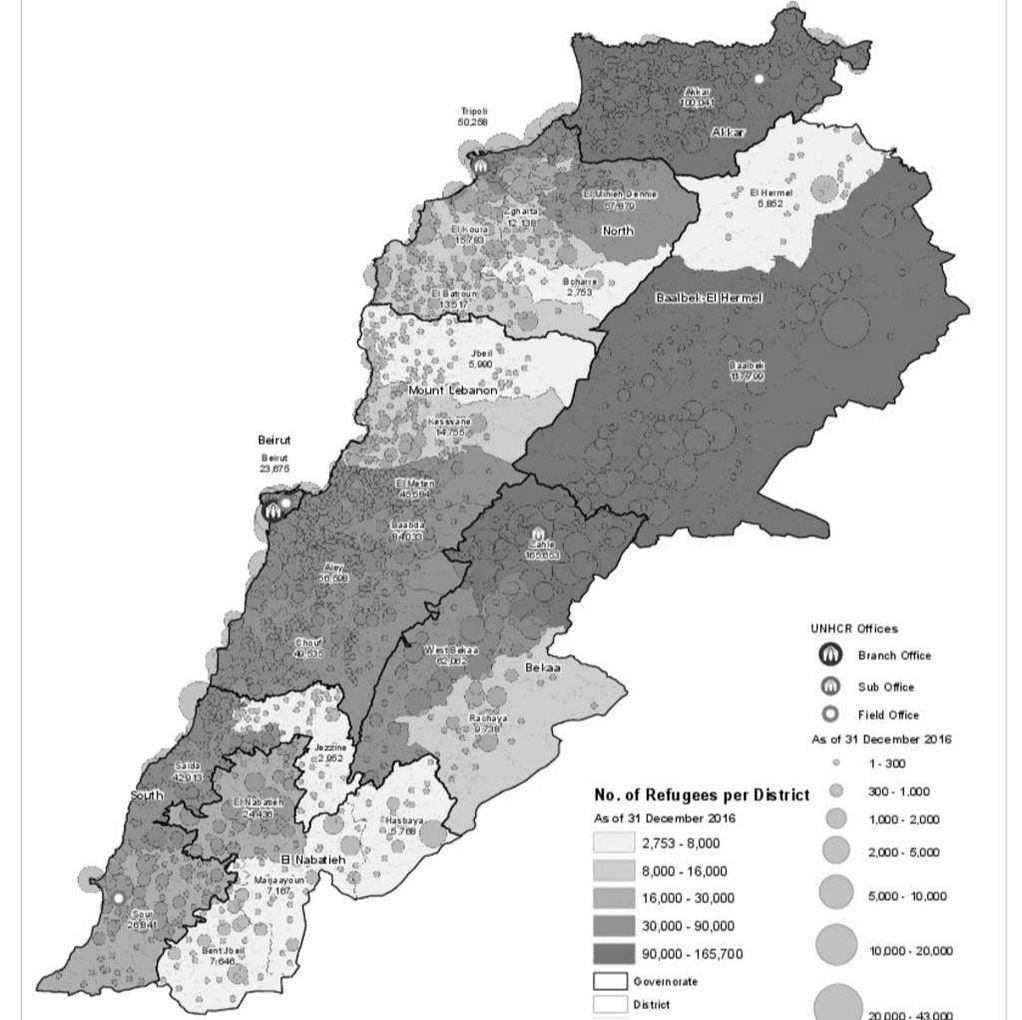
MAPPERCreate 3W maps to depict Who is doing What, and Where. Identify activities are being implemented. Compare key performance indicators to desired outcomes. Overlay layers of raster and vector maps. Create buffers around service delivery points to estimate service loads, and to identify target populations isolated from services.
|

|
|
GALLERY MANAGEROrganize data visualizations in an online data gallery with tables, graphs, maps, and other infographics. Use the gallery to provide reliable and timely access to ready-to-go data illustrations for publications and slide decks.
|

|

|
DOCUMENT REPOSITORyCreate and manage an online repository of documents, organized by source, date, topic, and keywords.
|

|
|
PORTAL MANAGERCreate an online portal to manage the dissemination of the information contained in the database. Publish data visualizations, dashboards, data stories, calendar of events, gallery, and document repository. Select from open source content management system (CMS) templates to manage the portal.
|

|

|
Create mobile apps for data analysis and reporting. Leverage the rapidly growing mobile phone community to reach new audiences with data for decision-making. Disseminate data to Android, iOS and Windows mobile phones.
|

|

|
ADVOCACY DESIGNERUse data visualizations and infographics to design posters, brochures, and videos for communications campaigns, conferences, seminars, and reports.
|

|

|
Learning studioDevelop e-learning courses to support the processes of capturing, managing, and using data for decision support. Develop short how-to videos to explain standard operating procedures.
|

|
